Wintrace is a generic Time Travel Debugger for Windows applications which focuses on delivering the lowest recording overhead.
Time travel debugging allows you to record the entire (or part of) execution of a process into a file and replay it later infinitely many times to analyze program behaviour and trace any bugs that happened in a recording session.
Once a crash or bug has been captured, time travel makes it dramatically easier to find the root cause because it removes the time consuming log-reproduce-debug cycle in order to understand what is the problem.
Windows already has a Time Travel Debugger available that is integrated with WinDbg, but it has poor recording performance due to the usage of an emulator for executing program's code. Wintrace improves on this by utilizing just-in-time compilation for all program code. This massively improves recorded program execution time allowing for more programs to be recorded & analyzed like games and more interactive apps. For single threaded scenarios, Wintrace achieves ~4-5x recording overhead.
A few benchmarks outlining recording overhead for different single threaded applications:
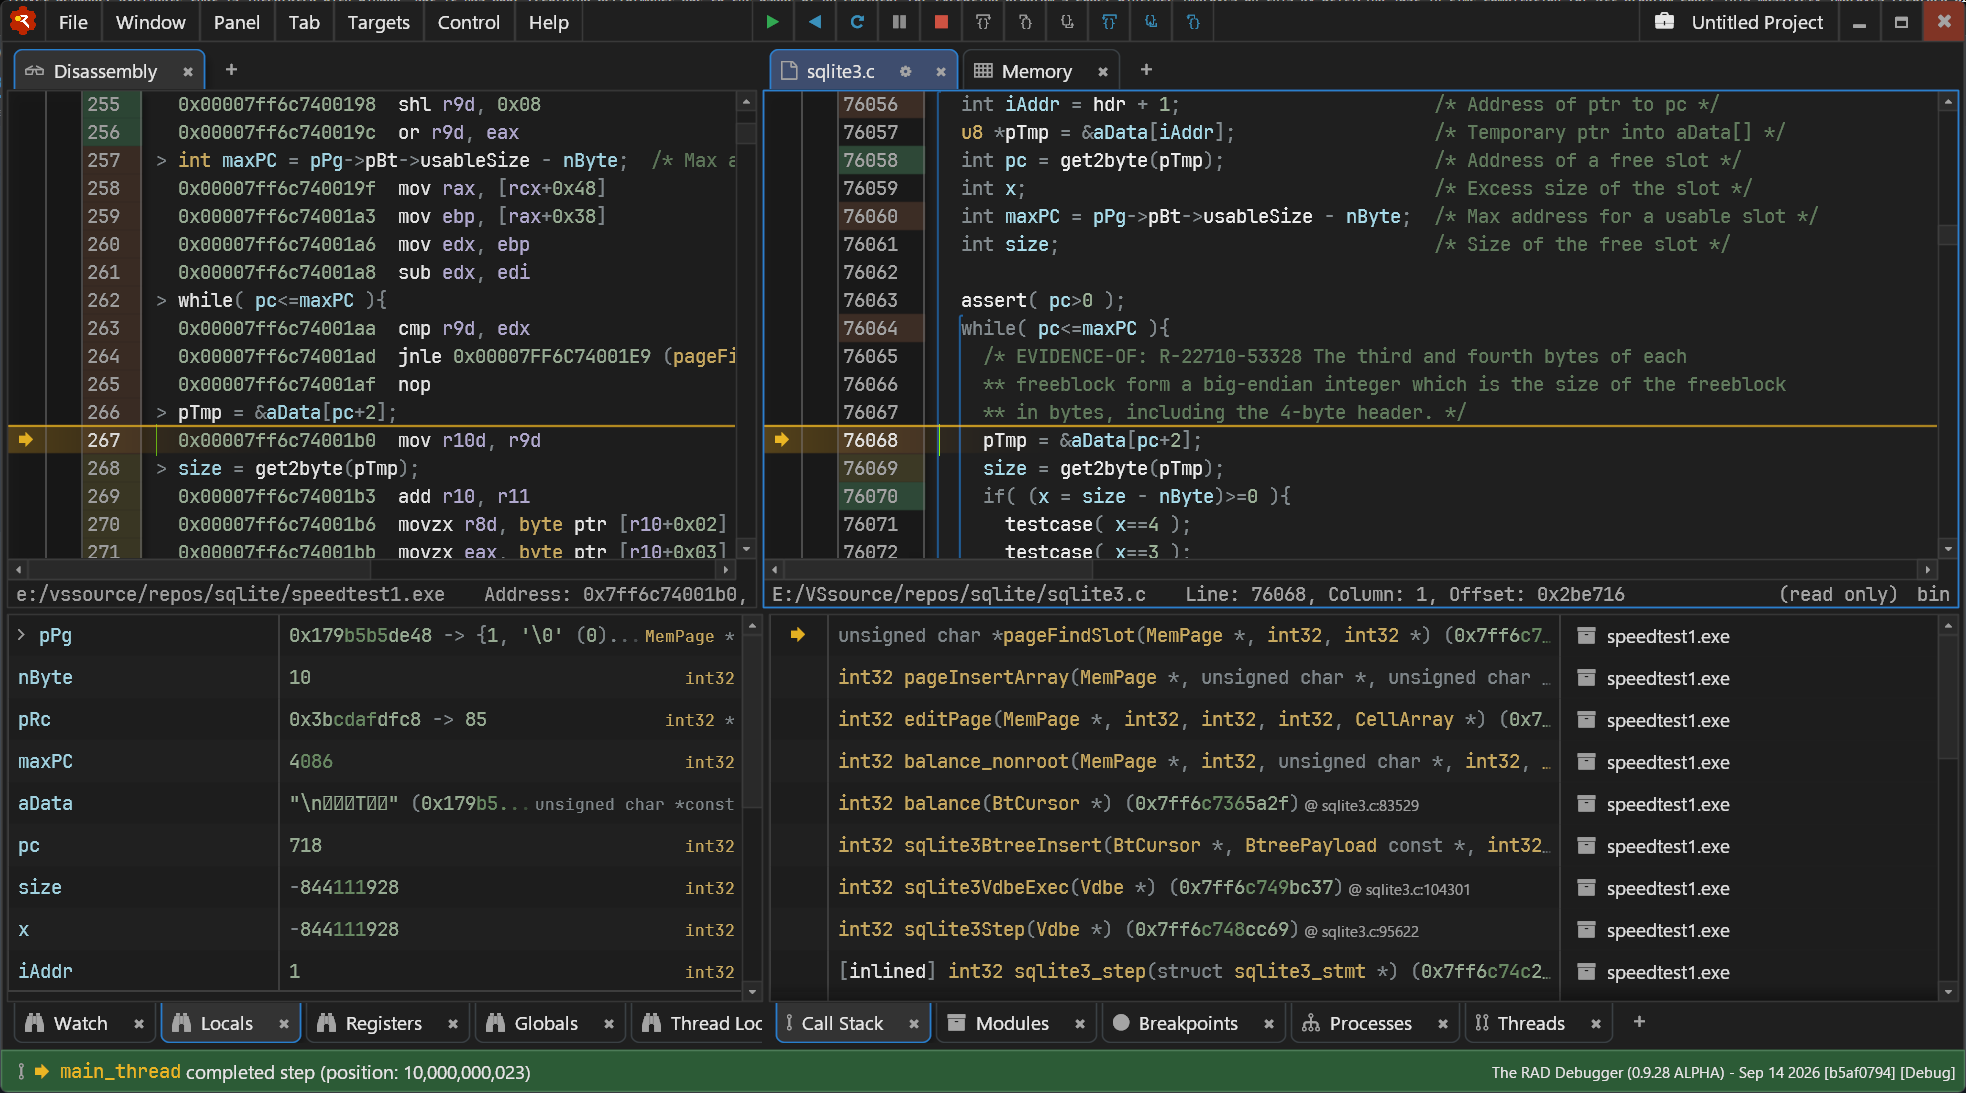
speedtest1.exe (release mode, from SQLite test suite)
- Native: 2.6s
- Wintrace: 16s
- WinDbg: 4min
clang -c -O2 onelua.c (compile onelua.c from the lua repo)
- Native: 2.7s
- Wintrace: 35s
- WinDbg: 6min 50s
- "The Witness" game
- Native: 171 FPS
- Wintrace: 42 FPS
- WinDbg: 3 FPS
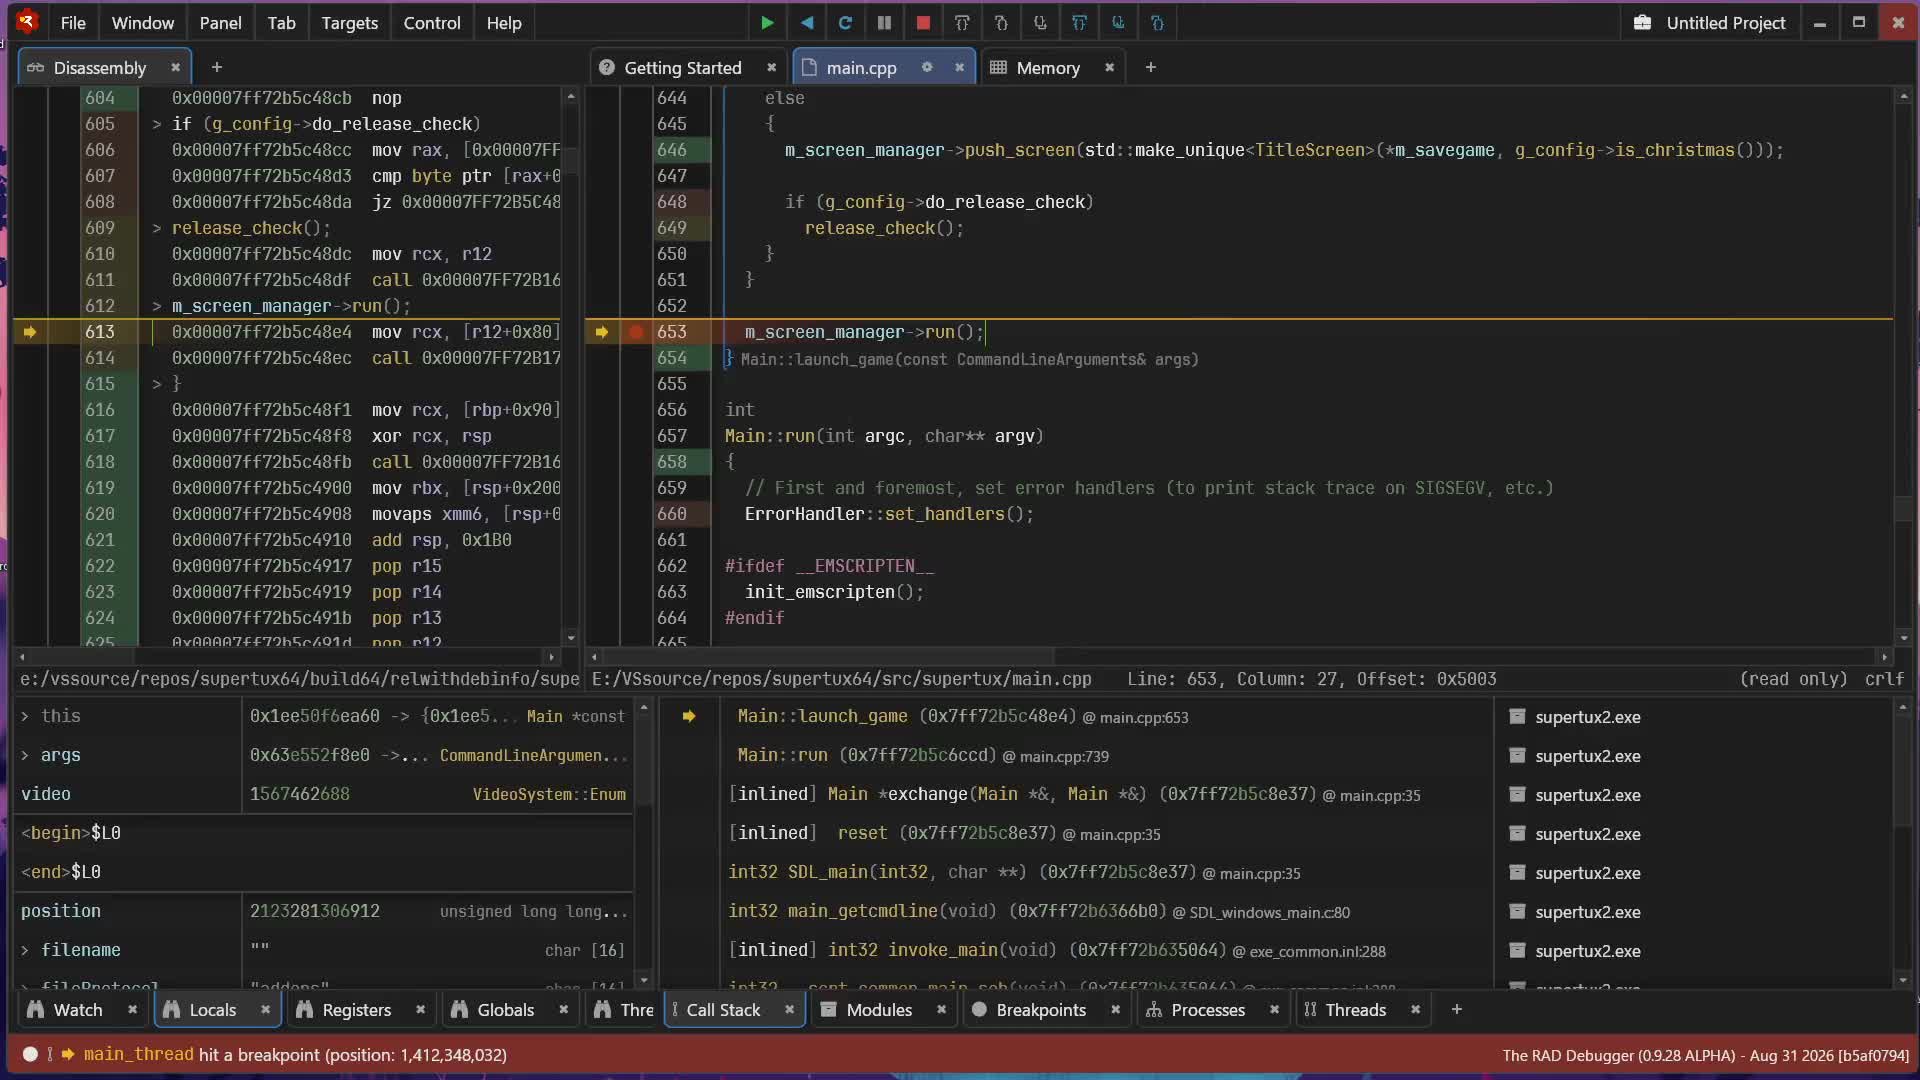
Wintrace's replay debugger is currently integrated with a fork of RAD Debugger. The replay functionality currently features a basic set of Time Travel controls such as forward & backward stepping and breakpoints:

In the future the replay engine can be expanded & integrated with other debuggers.
The project is under active development and supports x86-64 Windows applications with support for 32-bit planned. The replay engine supports only single threaded recordings at the moment.
This project does not use generative AI.